Home
Search

GNC Humanitarian Needs Analysis and Response Planning (HNRP) FAQs

This FAQ is intended for country coordination teams, partners, and analysts engaged in the HPC process. It complements the GNC Needs Analysis Guideline 2024 and the HPC Global Guidance 2026 by addressing common operational questions raised during past HNO and HRP cycles.


See below for FAQs covering key topics on:

  1. Tools and Processes
  2. Scope of Needs Analysis
  3. Data and Evidence
  4. Severity Analysis
  5. People in Need (PiN)
  6. Response Planning (HRP)


HNRP 2026 English

HNRP 2026 Français

HNRP 2026 Español

Anteneh Dobamo

Helpdesk on Nutrition Information System [email protected]

FAQs

What GNC tools and guidance should I use during the HNRP process?

TOOLS AND PROCESSES

The GNC provides a comprehensive package of tools and guidance for all steps of the Humanitarian Needs and Response Planning process. These tools allow you to:

  • Conduct severity analysis (to classify how serious the nutrition situation is).

  • Estimate the number of People in Need (PiN) of nutrition services.

  • Set response targets (deciding how many people you aim to reach with interventions).

  • Estimate financial requirements and supply needs for the sector.

The main reference is the GNC Needs Analysis Guideline 2024, which walks you through the process step by step.

In addition:

  • The GNC runs an annual webinars (EN, FR and SP) series on the Humanitarian Needs Overview (HNO) and Humanitarian Response Plan (HRP) processes, in English, French, and Spanish.

  • Past guidance materials and inter-cluster guidance documents are available on the GNC website.

  • You can get direct technical support by filling in the GNC support request form or contacting GNC team members directly.

What are the expected outputs of the nutrition sector Humanitarian Needs Overview (HNO) process?

TOOLS AND PROCESSES

At a minimum, the nutrition sector HNO should provide:

  • Drivers identification: A clear analysis of the main drivers of nutrition needs and related shocks (e.g., conflict , natural disaster, outbreaks& edpidemics/pandemics, social economic etc).

  • Geographical and population mapping: Identification of the affected administrative units and population groups (IDPs, host communities, returnees, etc.).

  • People in Need estimation: A disaggregated estimate of people in need of emergency nutrition services, by service type (e.g., wasting treatment, micronutrient supplementation, IYCF support etc.) and the overall total.

  • Severity ranking: A classification of the severity of needs across administrative units.

  • Methodological note: A short document that explains data sources, analytical steps, assumptions, and consultations used.

The process should be:

What are the expected outputs of the nutrition sector Humanitarian Response Planning (HRP) process?

TOOLS AND PROCESSES

The HRP should translate the needs into a plan for action. At minimum, it should include:

  • Priority setting: The top priority population groups and administrative units.

  • Target setting: Numbers of people targeted for preventive and curative nutrition services at the relevant administrative level.

  • Costing: Financial requirements for each service type, as well as the overall financial need for the nutrition sector.

  • Narrative explanation: A short text explaining the most critical needs, why these were prioritized, and the objectives of the response strategy. Usually OCHA/Inter cluster mechanism provided template for narrative explanation and summary of the response plan.

  • Supporting functions: Activities such as assessments and surveillance, coordination, monitoring and reporting, and training.


Which areas and population groups should be included in the needs analysis?

SCOPE OF NEEDS ANALYSIS

Areas directly affected by “core” shocks, as outlined in the HPC 2026 Guidance (EN and FR), should be included. Additional considerations include IDP populations and settlements, as well as areas with high acute malnutrition rates (GAM >10%) or high mortality, even if these areas are not directly affected by core shocks.

Can areas outside those designated as affected by the inter-cluster system be included?

SCOPE OF NEEDS ANALYSIS

Yes. For the nutrition sector, areas with high acute malnutrition rates (GAM >10%) should be included in HNO analysis even if they are not within areas designated as directly affected by “core” shocks.

Are internally displaced persons (IDPs) always counted among affected populations?

SCOPE OF NEEDS ANALYSIS

In most cases, IDPs are included in the HNO. If the IDP population is very small and can be adequately supported by services available to host populations, it may not be necessary to include them in the HNO analysis. However, such decisions must be made cautiously to avoid exclusion errors.

What data sources should I use for HNO analysis?

DATA AND EVIDENCE

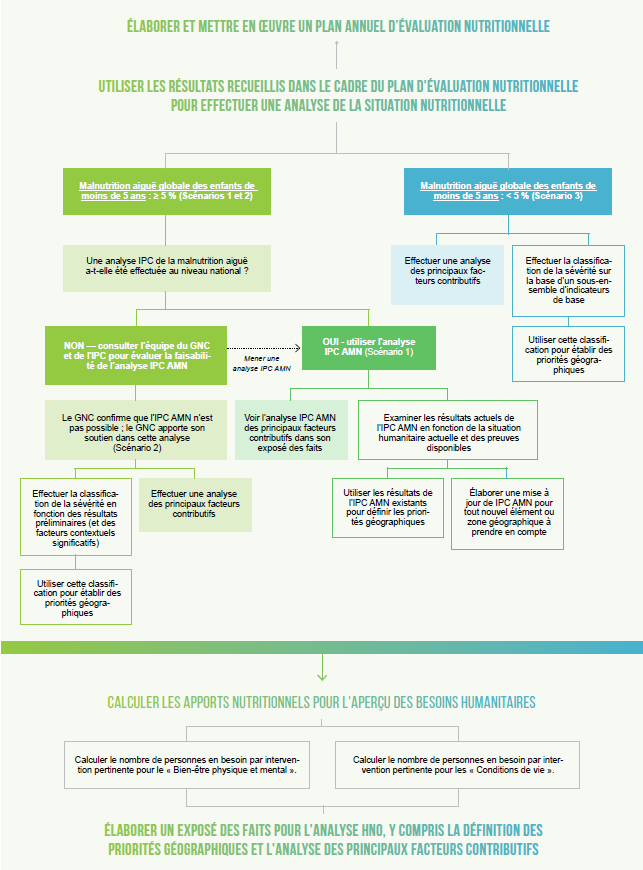
The starting point for any HNO analysis in the nutrition sector is to use the strongest, most recent outcome-level data available. Ideally, this means data collected within the last 6 months, and not older than 24 months.

Priority data sources include:

  • Household surveys such as SMART surveys, which provide GAM prevalence rates at the admin 3 level (or equivalent).
  • IPC Acute Malnutrition (AMN) analysis, if it covers most of the country and is up to date.

If outcome-level data are absent, incomplete, or outdated:

  • Use proxy indicators, such as MUAC screening data, dietary diversity, IYCF practices, morbidity rates, or micronutrient supplementation coverage.
  • Explore alternative data sources, for example: health facility reporting systems, nutrition surveillance systems, rapid assessments, or campaign-based data.
  • Always document clearly when and why proxy or alternative sources are used.

Further technical guidance on the use of alternative data sources is available in the GNC Needs Analysis Guideline and in dedicated GNC webinars (EN, FR and SP).

Note:  always start with the best outcome-level data you can find. If it’s missing or outdated, you can fall back on proxies and alternative sources - but you must be transparent about what you’re using and why.

How should I proceed with severity analysis if recent GAM data is not available?

SEVERITY ANALYSIS

In the absence of recent GAM data, proxy indicators and alternative data sources should be used. Detailed guidance on alternative data sources is available in GNC webinars (EN, FR and SP) and technical notes.

How should I conduct severity analysis if GAM prevalence is <5% in most parts of the country?

SEVERITY ANALYSIS

When GAM is low, use risk indicators instead of prevalence alone:

  • IYCF indicators (exclusive breastfeeding, MDD, MAD).

  • Micronutrient supplementation coverage and deficiency levels.

  • Food insecurity levels (e.g., IPC food security phases).

  • Morbidity data (childhood illnesses  such as diarrhea, ARI, measles incidence).

  • WASH indicators (access to safe water, sanitation).

  • Contextual factors like IDP density.

  • Any other contextually relevant indicators 

How do I apply the severity threshold for a proxy indicator?

SEVERITY ANALYSIS

For standard indicators (e.g., GAM prevalence, MAM/SAM admissions), the GNC provides a global severity reference table (pages 22 - 26) with thresholds ranging from 1 (minimal) to 5 (catastrophic). This makes it straightforward to classify severity.

However, for proxy indicators such as Proxy GAM using MUAC :

  • Global reference thresholds are not available.

  • Instead, country coordination teams and partners should calibrate the severity thresholds of the chosen proxy indicator.

  • Calibration should be done in alignment with the JIAF 2.0 severity calibration standards.

  • Teams should document clearly how thresholds were defined, including the rationale and data sources.

You should also:

  • Refer to the GNC Needs Analysis Guideline (see page 19 for details on proxy indicators and threshold calibration).

  • Contact the GNC technical team if additional guidance or review support is needed.

Note : if you use a proxy indicator, you need to set your own thresholds locally, making sure they are consistent with JIAF 2.0 standards and are agreed through consultation. There’s no “global table” to fall back on — calibration is your responsibility as a country team, but GNC can provide guidance.

Can IPC AMN severity classifications be used for HNO analysis?

SEVERITY ANALYSIS

Yes. If the IPC AMN analysis was conducted within 6 months (or updated within 6 months) of the HNO, it can be used for severity classification.

Can proxy indicators (e.g., MUAC) be used in severity analysis?

SEVERITY ANALYSIS

Yes, depending on the quality and coverage of the MUAC data. If MUAC data is available for most parts of the country (e.g., from micronutrient supplementation campaigns, Sentinel Surveillance , child health campaigns, or mass MUAC screenings) and meets acceptable quality standards(refer to GNC webinar on alternative data sources), it can be used for severity analysis and PiN estimation.

How does weighting work when multiple indicators are used in severity analysis?

SEVERITY ANALYSIS

When several indicators are combined to classify severity, they should not all be treated equally. Indicators differ in:

  • Their reliability (some are based on stronger, more recent, or more representative data).

  • Their relative importance for understanding the risk of acute malnutrition.

  • Their direct impact on morbidity and mortality

Therefore, rather than averaging all indicators equally, a relative weighting system should be applied. This ensures that the most reliable and most relevant indicators have greater influence on the final severity classification.

The weighting process should always:

  • Be consultative: discussed with partners, national authorities, and technical experts.

  • Be consensus-driven: agreed upon transparently to avoid bias.

  • Be documented: with a clear explanation of how weights were assigned.

The GNC can provide technical support to countries undertaking this process, including examples from other contexts.

Key points to remember:

  • Indicators are not equally reliable or equally important.

  • Apply relative weighting that reflects each indicator’s reliability and influence on acute malnutrition risk.

  • Develop weighting through a consultative, consensus-based process, not unilaterally.

  • Seek GNC technical support when needed to design or validate the weighting system

What nutrition services can be included in the PiN estimation?

PEOPLE IN NEED (PiN) ↓

Both preventive and curative nutrition services, as well as cash and voucher assistance, can be included. A full list of services is provided in the GNC Needs Analysis Guidelines (p. 31). Country coordination teams and partners should review the list and select the services applicable to their context.

How do I calculate the PiN for wasting among children 0–59 months?

PEOPLE IN NEED (PiN) ↓

Three methods are recommended by the GNC:

  1. Use the most recent and reliable treatment coverage data for acute malnutrition (preferred).

  2. Apply a country-specific incidence factor that reflects the local context.

  3. As a last resort (though most common), apply the global incidence factor of 2.6 × prevalence.

The GNC Needs Analysis Guidance and Tool provides detailed instructions on the process.

Can micronutrient supplementation and IYCF needs in affected areas be included in the PiN?

PEOPLE IN NEED (PiN) ↓

Yes, but only the gap not covered by routine health and nutrition services should be included. In most countries, these services are delivered through routine systems; duplicating the full need would risk overlapping with development actors’ roles. Inclusion is appropriate in contexts where routine services are disrupted—such as among IDPs, populations affected by natural disasters, or in conflict zones.

Which administrative units and severity levels should be considered when estimating the total PiN?

PEOPLE IN NEED (PiN) ↓

According to the most recent global inter-cluster recommendation:

  • PiN should be estimated from areas with severity levels 4 and 5.

  • Up to 50% of needs from areas with severity level 3 may be included, in consultation with the inter-cluster mechanism at the country level or with HCT approval.

Which services should be included in the Nutrition sector Humanitarian Response Plan (HRP)?

RESPONSE PLANNING (HRP) ↓

The HRP package should include both preventive and curative services, as well as cash and voucher assistance. A full list of services is provided in the GNC Needs Analysis Guidelines (p. 31). Country coordination teams and partners should review and adapt this list to their specific context.

What level of coverage should be targeted in the HRP?

RESPONSE PLANNING (HRP) ↓

In line with SPHERE standards:

  • At least 50% coverage should be targeted overall.

  • In formal camp settings, at least 90% coverage should be targeted.

  • In peri-urban and urban settings, at least 70% coverage should be targeted.

In contexts with uncertain funding or implementation feasibility, prioritization of critical needs is warranted.

How are the financial requirements for the HRP estimated?

RESPONSE PLANNING (HRP) ↓

Two main costing approaches are applied globally:

  1. Project-based costing – derived from partner project submissions.

  2. Activity/per-capita costing – based on an agreed unit cost per service.

A hybrid approach may also be used. The choice depends on context, available data, and coordination capacity.

  • Where a commonly agreed per-capita cost exists, activity-based costing is recommended.

  • Where costs vary significantly and sufficient time exists for partner project submissions and peer review, project-based costing may be used.

  • In hybrid approaches, aggregate requirements are estimated using per-capita costs, with partner projects submitted afterwards to track funding status once the HRP is published.

          For the HNRP 2026, OCHA will likely be advising to prioritize the activity based costing. 

Featured Resources

Subscribe

to receive GNC newsletters